Event Log
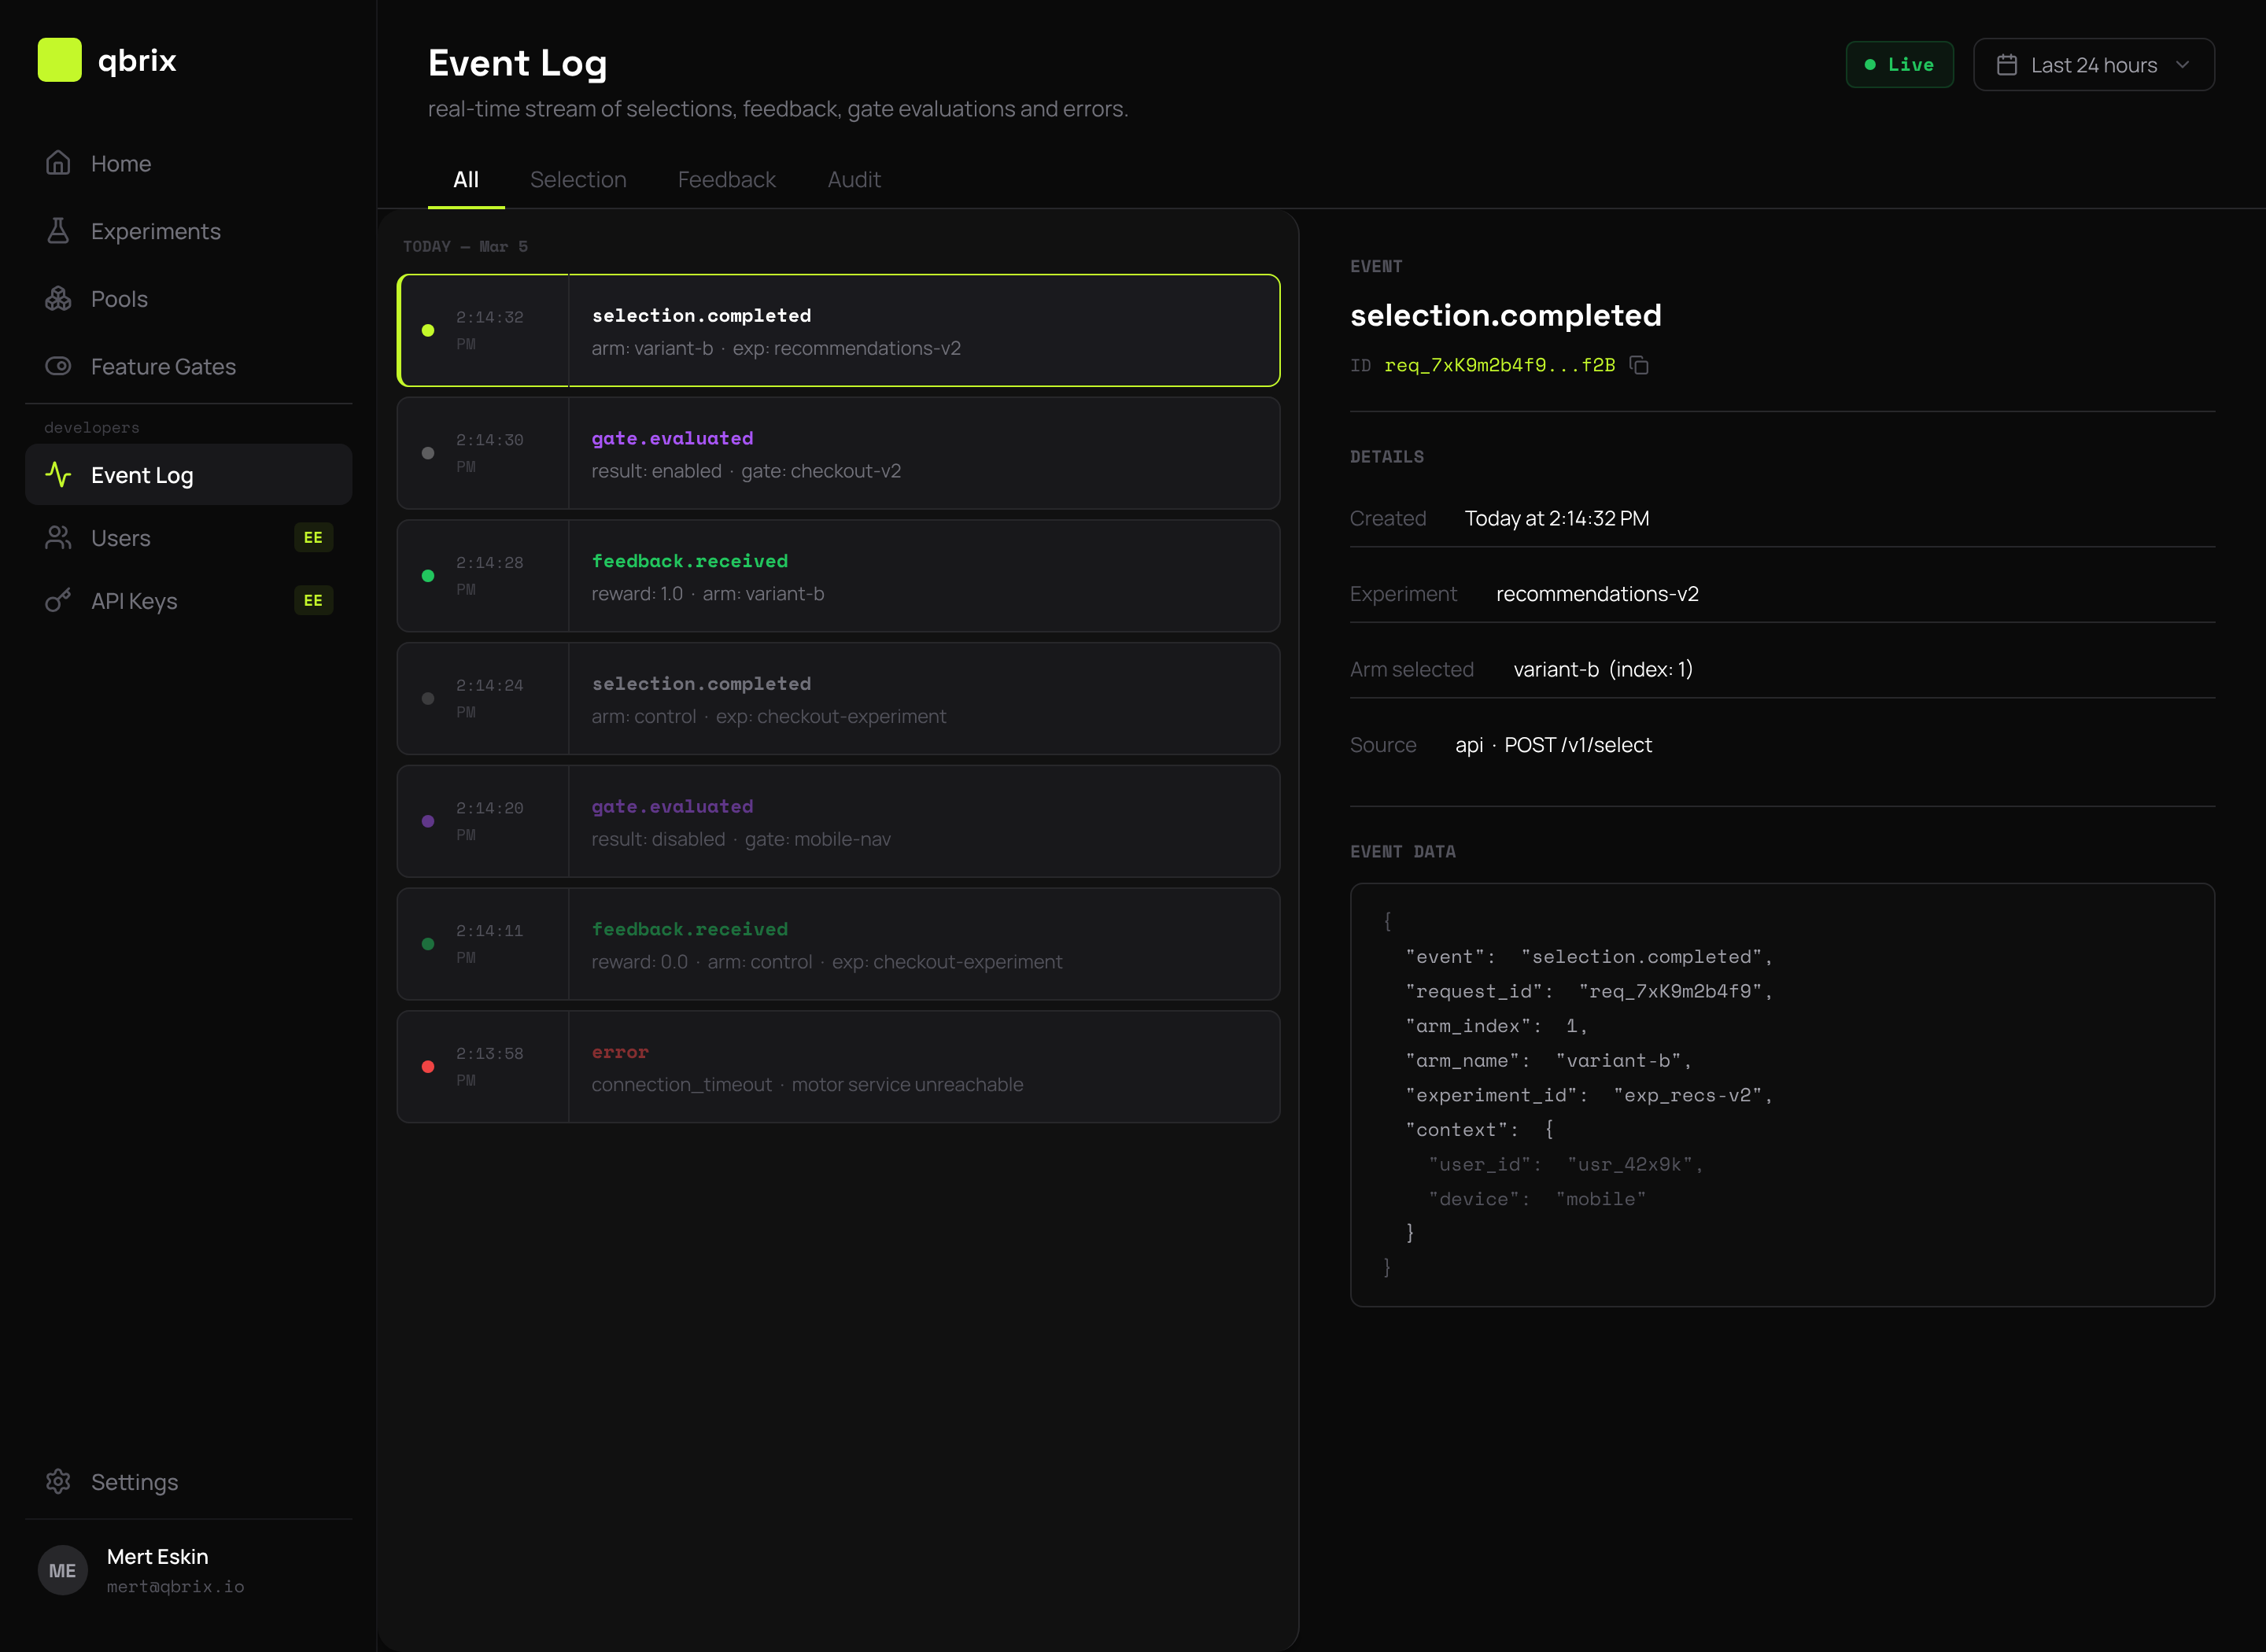
EnterpriseThe Event Log under Developers → Event Log in the console gives you a real-time, queryable view of every event qbrix has processed. It's powered by the tracesvc consumer that drains the Redis Streams into ClickHouse, so the lag from "event happens" to "you see it in the log" is typically under a second.
Three Event Types
Qbrix publishes three independent streams. The Event Log lets you filter by type:
| Type | Source | Contents |
|---|---|---|
| Selection | Every select() call | request_id, experiment_id, chosen arm_id, context, is_default flag |
| Feedback | Every feedback() call | request_id, reward, latency from selection |
| Audit | Control-plane writes | who created/updated/deleted what (experiments, pools, gates, API keys, members) |
Use the type tabs to flip between them, or set type to All to see them interleaved.
Filtering & Search
The filter bar supports:
- Time range — last 5m / 1h / 24h / 7d / custom.
- Experiment — narrow to a single experiment ID.
- Actor — for audit events, filter by user or API key.
- Free-text search — matches request IDs, arm names, and audit payloads.
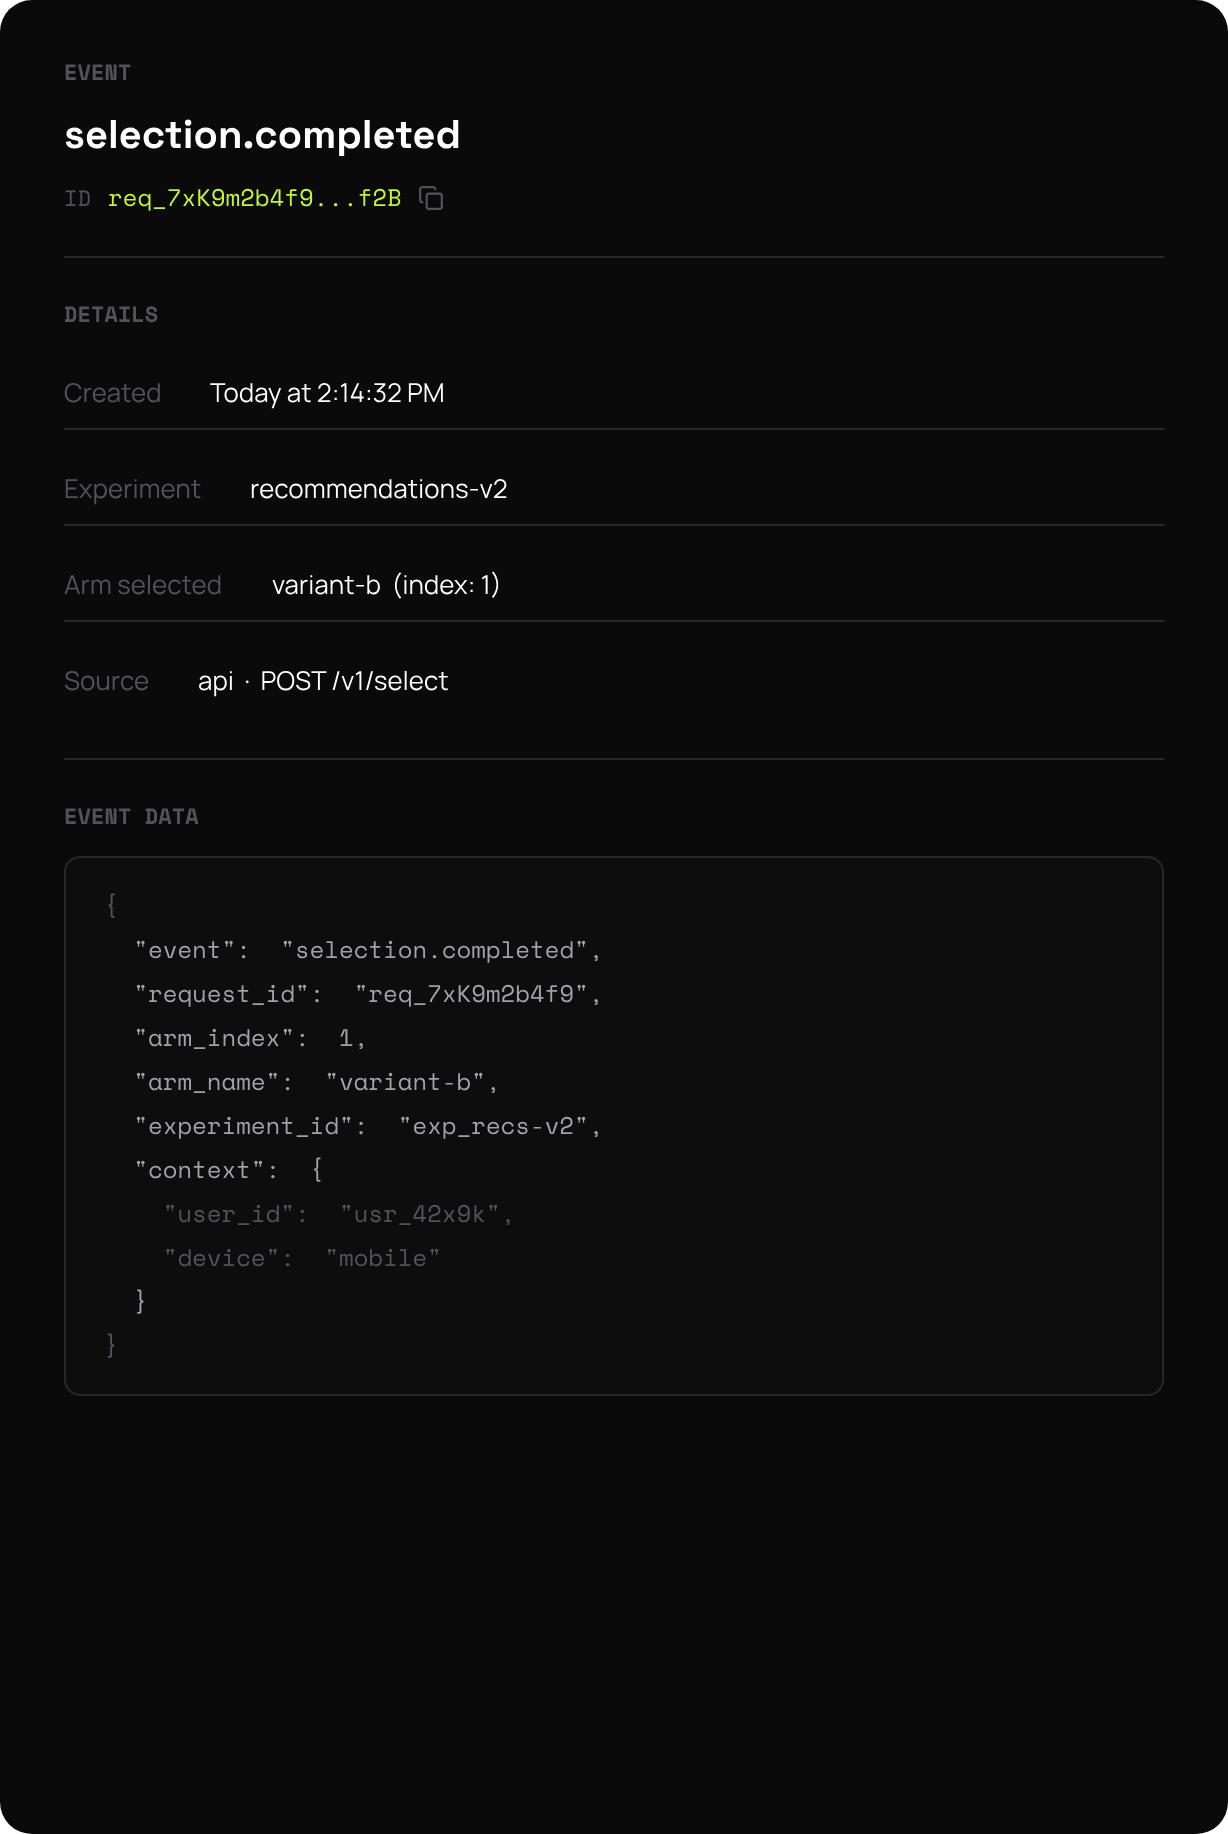
Each row expands to show the full event payload as JSON. Click the Copy icon to grab a request_id for debugging.
Common Use Cases
Debugging a missing reward. Filter by request_id to see whether the selection event was logged but the feedback event was not — usually points to a client-side bug or a misrouted webhook.
Auditing a config change. Filter by audit + actor to see exactly when an admin disabled an experiment or rotated an API key.
Spot-checking the bandit. Filter by selection + a single experiment to confirm that traffic is actually being distributed across arms (and that the gate isn't accidentally serving 100% default).
Latency spelunking. Feedback events include the time delta from their matching selection — useful for catching slow client integrations.
Retention
Event Log retention depends on your plan tier:
| Tier | Retention |
|---|---|
| free | 24 hours |
| starter | 7 days |
| pro | 30 days |
| enterprise | configurable (default 90 days) |
Events older than the retention window are evicted from ClickHouse but remain available via your own analytics export if configured.
The Event Log is an Enterprise Edition feature. Open-source deployments can still publish events to Redis Streams and consume them with their own pipelines — only the console UI and ClickHouse-backed search are gated.
Next Steps
- Console Experiments — the day-to-day surface for running bandits
- Architecture — how event streaming actually works under the hood